Overview
This post is about my Digital Transformation course project. The idea was to build a small smart city style network and use it to test AI based threat detection.
The lab was kept isolated in VirtualBox. We generated normal web traffic and attack traffic, captured the packets, turned them into a dataset, trained different machine learning models, and then used the best model inside a simple live IDS prototype.
This was a group project, so the work covered different parts of the full pipeline. My main focus was around the IDS prototype and the feature selection side, especially making sure the model was using traffic behavior instead of just memorizing IP addresses.
Lab Setup
The lab used three virtual machines connected to an internal VirtualBox network called SmartCity_Net. This kept the testing inside the lab and away from the host machine and the internet.
| Machine | Role | IP Address |
|---|---|---|
| Kali Linux | Attacker machine | 192.168.122.10 |
| Windows Server 2022 | Target server running IIS | 192.168.122.20 |
| Bodhi Linux | Normal client and monitoring machine | 192.168.122.30 |
The Windows Server machine hosted the IIS web service. Bodhi Linux was used to generate normal HTTP traffic and capture packets. Kali was used to generate attack traffic.
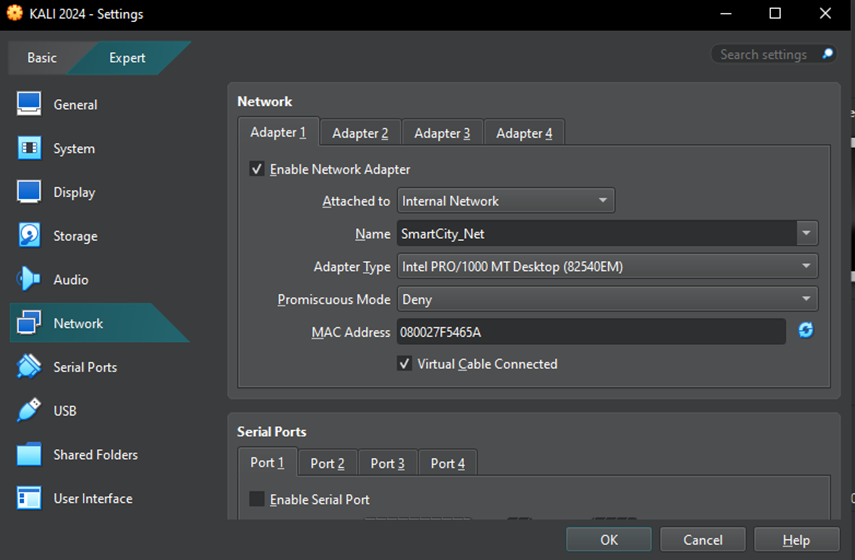
After setting the static IPs, the machines were tested with ping to confirm that they could communicate inside the isolated network.
Preparing the Web Service
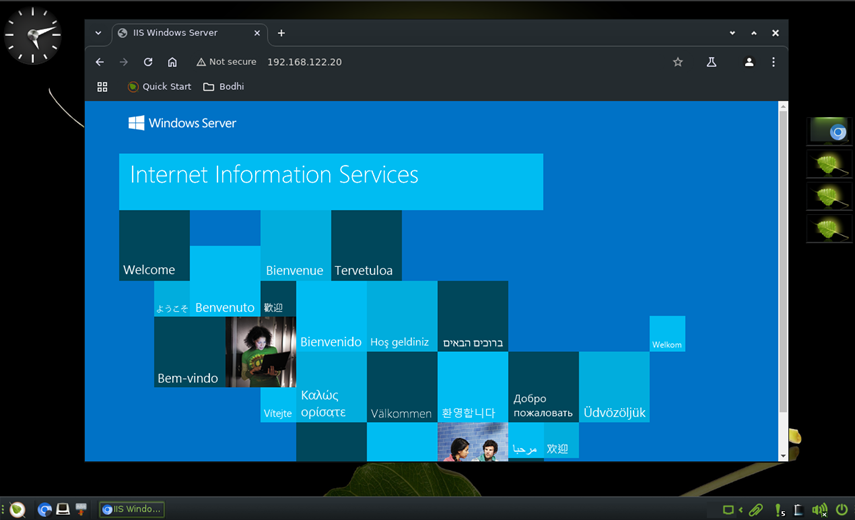
Windows Server was used as the target because it gave the lab a simple real service to attack and monitor. IIS was installed and the default web page was used as the target web application.
The service was available at:
Generating Normal Traffic
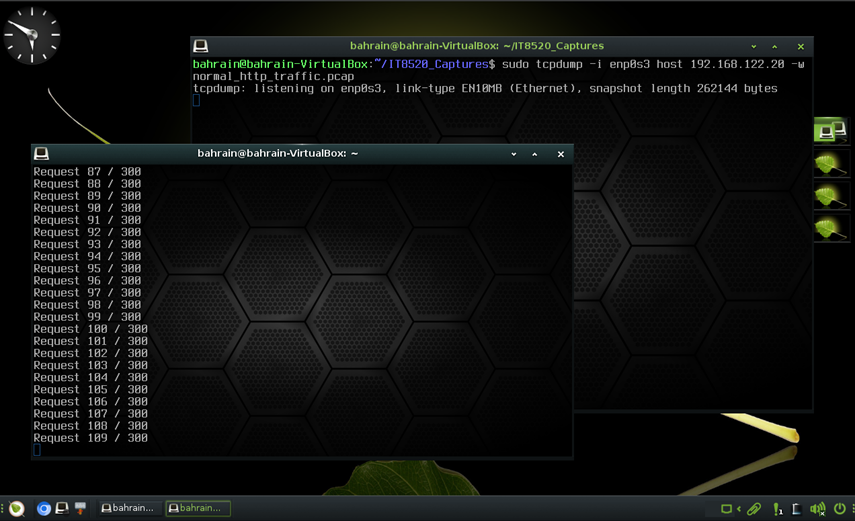
Normal traffic was created from Bodhi Linux by repeatedly requesting the IIS page from the Windows Server. This gave the dataset regular HTTP request and response traffic.
for i in {1..300}; do echo "Request $i / 300"; curl -s http://192.168.122.20 > /dev/null; sleep 0.2; done
The capture was saved using tcpdump:
sudo tcpdump -i enp0s3 host 192.168.122.20 -w normal_http_traffic.pcap
Generating Attack Traffic
For attack traffic, Kali was used to run a TCP SYN flood against port 80 on the Windows Server. This fits the smart city idea because denial of service attacks can affect public services that need to stay available.
The capture was started from Bodhi Linux:
sudo tcpdump -i enp0s3 host 192.168.122.20 -w attack_syn_flood_traffic.pcap
Then the attack was started from Kali:
sudo hping3 -S -p 80 --flood 192.168.122.20
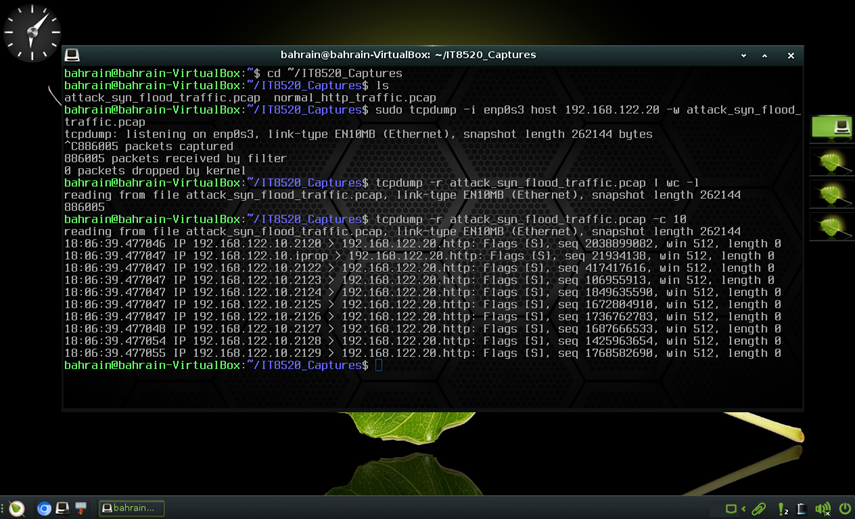
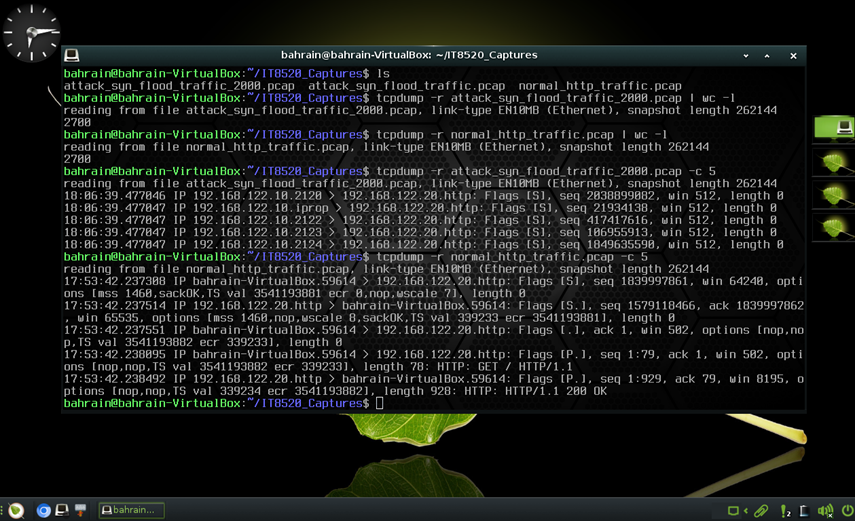
After capturing both traffic types, the packet counts were checked. The normal and attack captures both had 2700 packets, which helped keep the first raw dataset balanced.
Turning PCAPs Into Features
The PCAP files could not be used directly by the machine learning models. They had to be converted into structured CSV data first.
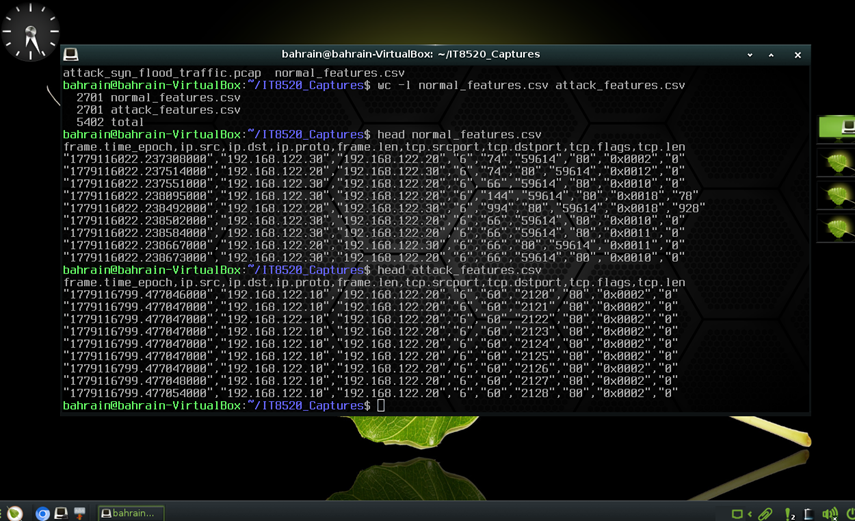
tshark was used to extract packet fields such as time, source IP, destination IP, protocol, frame length, TCP ports, etc. These fields were selected because they describe packet behavior and can help identify patterns like SYN flood traffic.
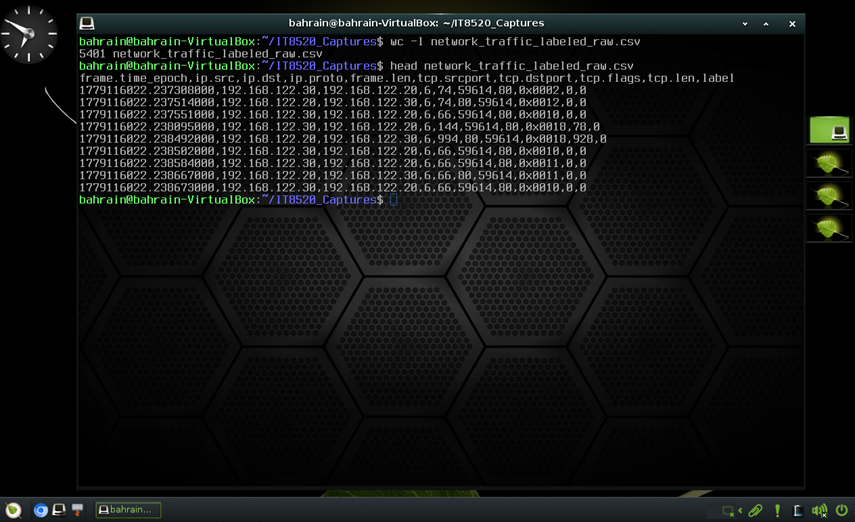
The normal and attack feature files were then combined into one labeled dataset. Normal traffic used label 0, and attack traffic used label 1.
Cleaning the Dataset
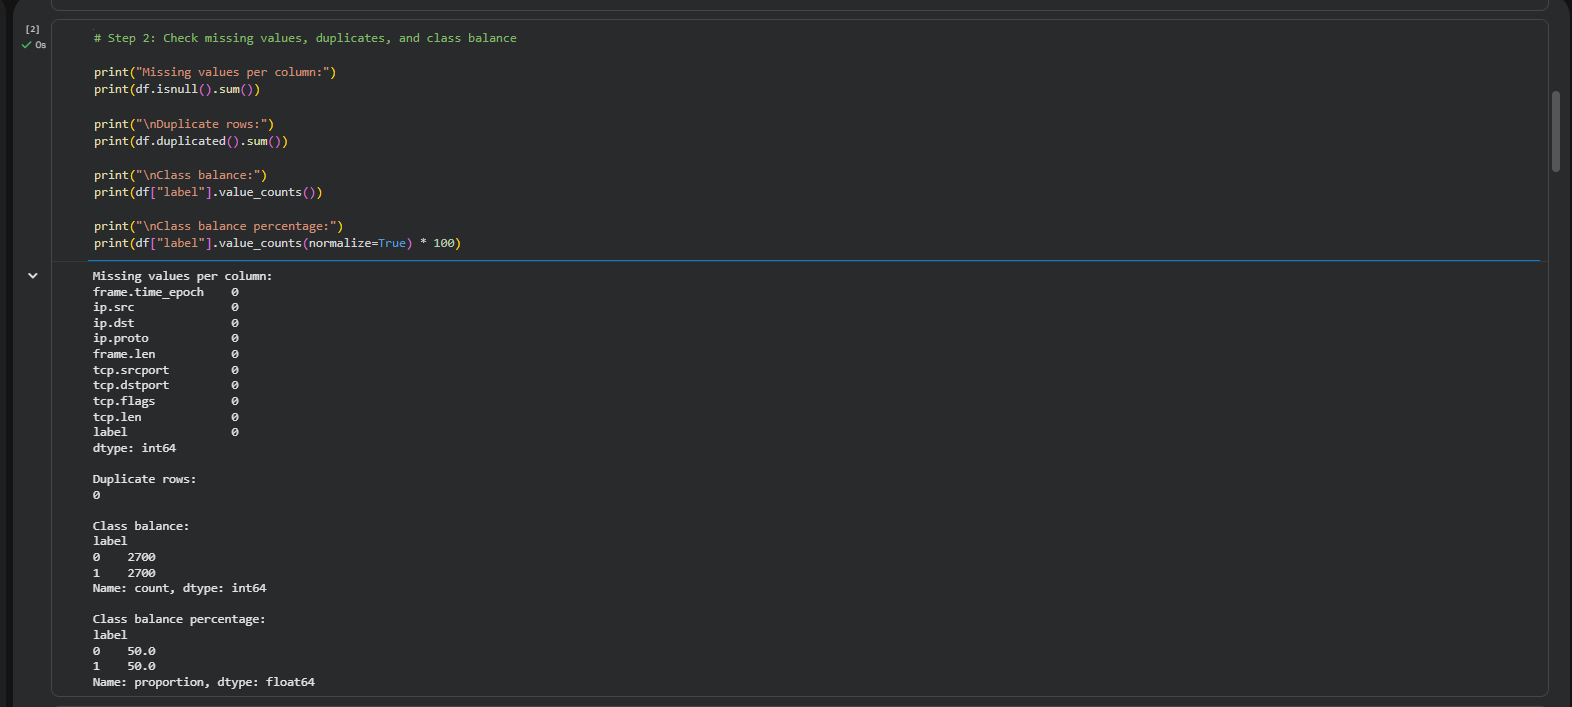
The next part was done in Google Colab because it already had the needed Python libraries. The dataset was loaded with pandas and checked for missing values, duplicates, and class balance.
Some fields needed cleaning before model training. TCP flags were stored as hex text, so they were converted into numeric values. Missing TCP values for non-TCP traffic were filled with 0. Non-IP rows were removed because they did not have the fields needed for prediction.
A key decision was to remove direct IP address identity and timestamp values from the model features. If the model learns that one IP address always means attack traffic, then it is not really learning attack behavior. It is just memorizing the lab setup.
The final engineered dataset had 5000 rows with a more realistic split: 4000 normal records and 1000 attack records.
Training the Models
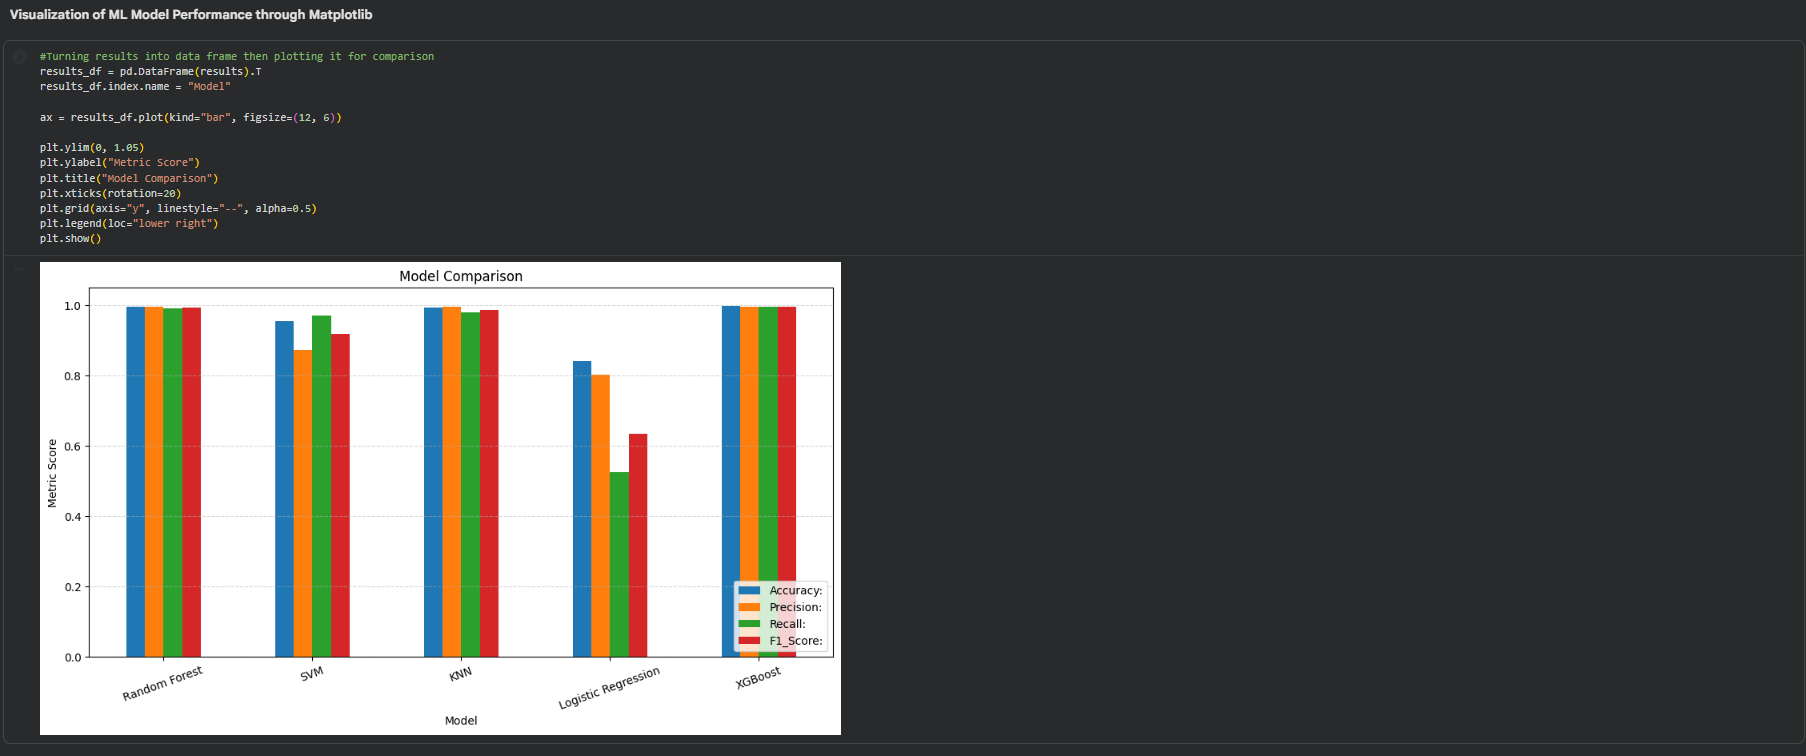
Five machine learning models were trained and compared:
| Model | Notes |
|---|---|
| Random Forest | Strong performance and easier to use in the live IDS prototype |
| SVM | Good model, but had precision issues in the comparison |
| KNN | Worked well on this dataset, but can become slow with larger data |
| Logistic Regression | Fast and simple, but weaker on this traffic pattern |
| XGBoost | Very strong model, but harder to tune and heavier to manage |
The dataset was split into training and testing data using an 80/20 split. Scaled data was used for SVM, KNN, and Logistic Regression because those models are more sensitive to feature scale.
The comparison showed that Random Forest and XGBoost performed the strongest overall. Random Forest was chosen for the IDS prototype because it had strong detection performance and was simpler to integrate into the live script.
Building the Live IDS Prototype
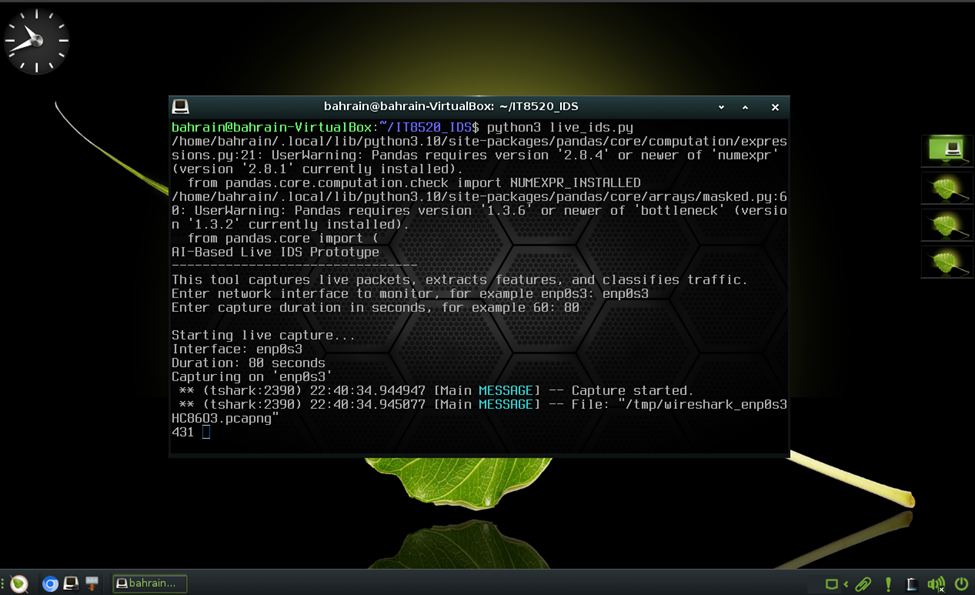
After training, the Random Forest model, scaler, and feature list were saved. The live IDS script loaded those files and used tshark to capture packets from the monitoring interface.
The script asked for the network interface and capture duration. In the lab, the interface was enp0s3, which was connected to the isolated network.
The main workflow of the script was simple:
- 1 - Capture live packets with
tshark. - 2 - Extract the same fields used in training.
- 3 - Clean the live packet data.
- 4 - Convert TCP flags from hex to numeric.
- 5 - Select the saved feature columns.
- 6 - Scale the features.
- 7 - Predict whether each packet is normal or malicious.
- 8 - Save the detailed results to
live_ids_results.csv.
Testing the IDS
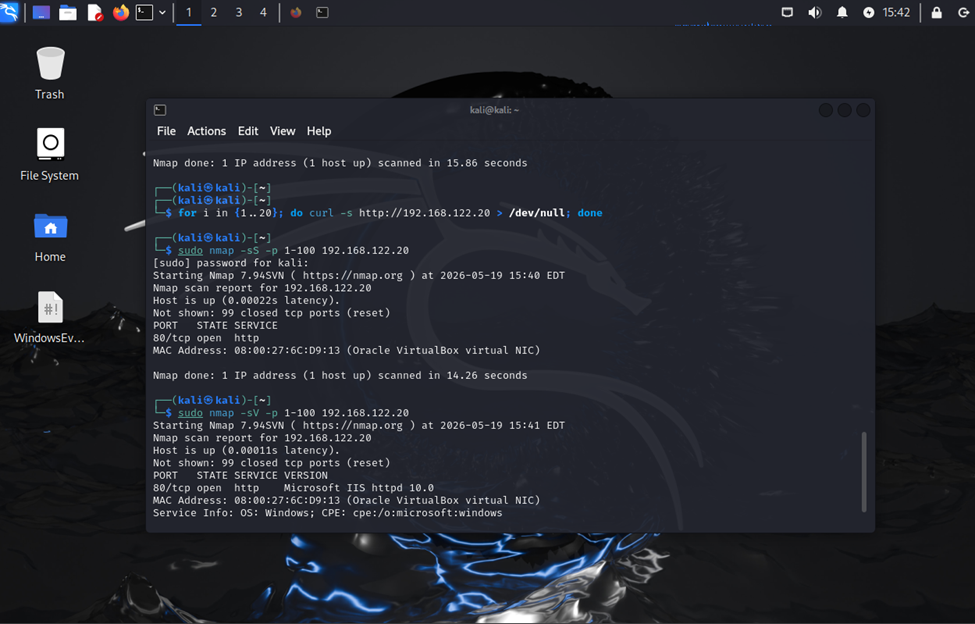
The IDS was tested with live traffic between Kali and the Windows Server. Normal HTTP requests were generated first, then scan traffic was generated from Kali.
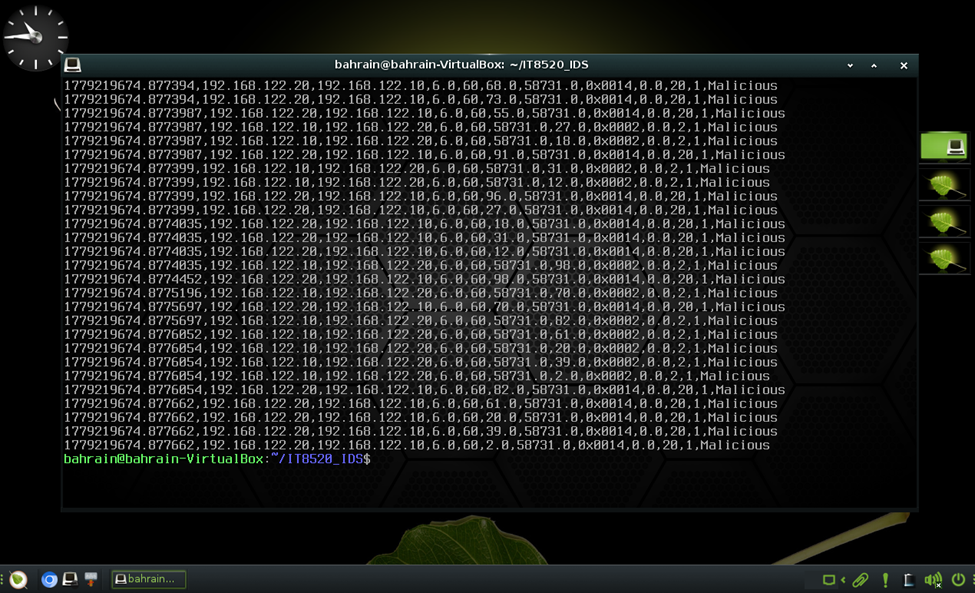
In the shown test, the IDS classified 427 packets. It detected 180 packets as normal and 247 packets as malicious, so it displayed an alert.
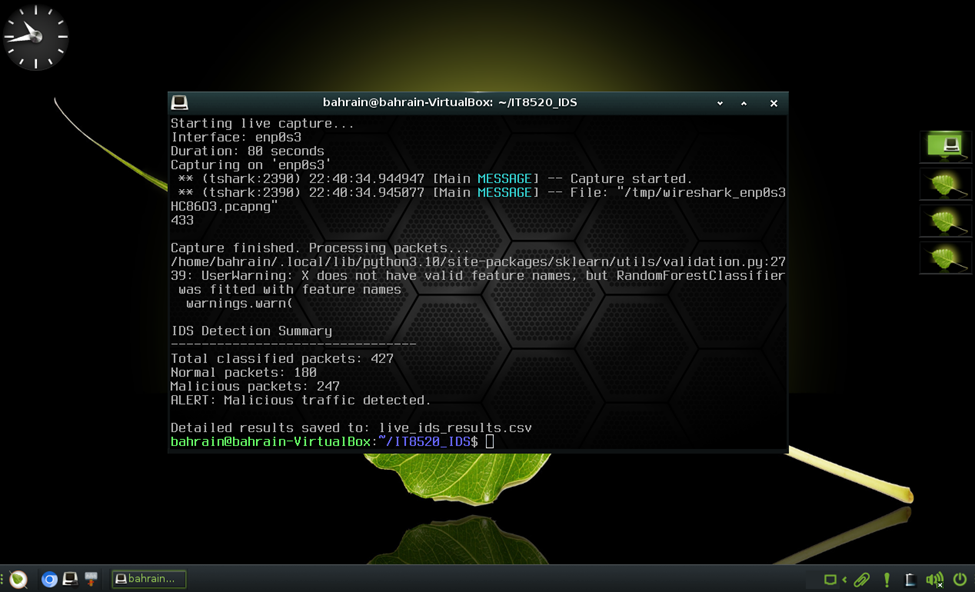
The results file also showed packet level predictions, which made it easier to inspect what the model classified.
What I Learned
This project helped me connect cybersecurity with machine learning in a practical way. The main value was building the full path from lab traffic to a working IDS prototype, not just training a model in Colab.
The biggest lesson was that feature selection matters a lot. If the wrong fields are used, the model can look good in testing but fail in a different network. Removing IP addresses and timestamps made the project more realistic because the model had to focus more on packet behavior.
I also learned that model performance is not the only thing that matters. A model can have strong results but still be difficult to use in a live tool. For this project, Random Forest made sense because it balanced performance and simplicity.
Future Improvements
The lab prototype worked, but there are many ways to improve it.
The dataset should be larger and include more traffic types. A real smart city network would have more devices, more users, and more services running at the same time.
More attack types should also be added. This project used SYN flood traffic and scan traffic, but future testing could include brute force attempts, DNS attacks, malware style communication, and abnormal IoT traffic.
The IDS could also be improved with a dashboard. Instead of only printing alerts in the terminal, it could show packet counts, recent alerts, graphs, and summaries. A later version could also connect alerts to response actions, like logging incidents, rate limiting traffic, or blocking repeated malicious sources.
Final Thoughts
This project was a good way to practice defensive security from a different angle. It combined lab networking, packet capture, dataset building, machine learning, and live detection in one workflow.
The IDS is still a prototype, but it shows the main idea clearly. If the traffic can be captured, cleaned, and converted into useful features, then machine learning can help detect suspicious behavior before it becomes a bigger problem.